The actual failure mode
This was not “we need more observability.” We already had too much of the wrong kind. Metrics were owned by whoever added them. Alerts fired on resource cliffs. On-call hopped between team dashboards because there was no shared definition of a healthy service.
What on-call saw
- Per-service dashboards with incompatible panel names and units.
- Alerts on CPU at 95% and disk at 98%, after users already felt pain.
- No standard way to tell “slow” from “broken” from “saturated.”
- Error rate buried in log searches while latency lived in APM.
- Deployments and dependency flaps invisible on the primary board.
What was missing in the stack
- No instrumentation contract. App teams emitted whatever felt useful.
- No SLI mapping. Metrics existed; SLOs were hand-waved.
- No triage protocol. Investigation order depended on who was paging.
- Host metrics treated as product health. They are capacity signals, not experience.
- Saturation ignored until Duration and Errors were already on fire.
What DURESS is (and is not)
DURESS is not a vendor product and not a new signal type. It is a lens over MELT (Metrics, Events, Logs, Traces): six dimensions you must cover for every critical service before you add more custom metrics. If a metric does not map to one of these, it is usually a billing line item, not a monitoring signal.
The six dimensions: Duration, Utilization, Rate, Errors, Saturation, System health. Teams often ask how this relates to Google’s four golden signals, Tom Wilkie’s RED method, and Brendan Gregg’s USE method. Short answer: DURESS is the union of RED and USE, plus a System health row so change and dependency context live on the same board.
| Signal | RED | USE | DURESS | Why it matters in incidents |
|---|---|---|---|---|
Rate |
Yes | Yes | Throughput shape; silent traffic death | |
Errors |
Yes | Yes* | Yes | Availability SLI / error budget burn |
Duration |
Yes | Yes | Latency SLI; customer experience | |
Utilization |
Yes | Yes | How much capacity is in use | |
Saturation |
Yes | Yes | Leading indicator before latency/errors | |
System health |
Yes | Deploys, synthetics, dependency flaps |
*USE’s “Errors” are resource/device errors (disk failures, network drops), not HTTP 5xx. DURESS keeps both: request Errors for the SLI, and resource Errors under Utilization/Saturation investigation when the platform shows them.
Use RED alone if you only own request-driven microservices and someone else owns capacity. Use USE alone for hosts, disks, and NICs. Use DURESS when one on-call team has to answer both “are users hurting?” and “what resource or change caused it?” without switching mental models.
End-to-end latency for the customer path, not only the handler you own. Prefer histograms and traces over average latency gauges.
http_server_duration_ms p50/p95/p99
db_query_duration_ms
job_duration_seconds
How much of a finite resource is in use: CPU, memory, heap, thread pool, connection pool. Mostly agent or platform metrics. App teams should not reinvent these as custom metrics.
cpu_percent
heap_used_bytes
connection_pool_active
goroutine_count
Operations per unit time. A sudden drop is as actionable as an error spike: something stopped processing or traffic shifted away.
requests_per_second
messages_consumed_rate
http_requests_total
Failed operations as a ratio and as typed counts. Feed availability SLIs from this dimension. Correlate metrics with error logs and failed traces.
error_rate_percent
http_5xx_ratio
exception_count_total
failed_jobs_count
How close to the limit. Queue depth, pool waiters, disk fullness, GC pressure, backpressure. Alert here before Duration and Errors explode.
queue_depth
connection_pool_wait_count
disk_percent_full
gc_pressure_percent
Is the system in the intended state? Health checks, synthetic probes, dependency up/down, deploy markers, feature-flag flips. Often events, not continuous gauges.
health_check_status
synthetic_probe_success
dependency_up
deployment_event
Signal contract: map before you emit
Platform engineering owned the contract. Service teams owned compliance. Before a metric shipped to production, it had to answer four questions: which DURESS dimension, which SLI it feeds, who is on-call when it pages, and what cardinality labels are allowed.
| Dimension | SLI shape | Typical alert | Do not do this |
|---|---|---|---|
Duration |
Latency SLI: % of requests under threshold | p95 breach for N minutes on critical route | Alert on average latency only |
Utilization |
Capacity SLI / capacity planning | Warn at sustained 70-80%, page before cliff | Page only at 99% CPU |
Rate |
Throughput / traffic shape | Sudden drop vs baseline, or consumer lag climb | Ignore silent traffic death |
Errors |
Availability SLI / error budget | Burn-rate alerts on SLO, not raw 5xx spikes alone | Page on every exception type |
Saturation |
Leading indicator | Queue/pool wait above warn before latency SLO burns | Discover saturation only during RCA |
System health |
Change + dependency context | Synthetic fail + dependency down; annotate deploys | Investigate without change timeline |
# Duration: p95 latency
histogram_quantile(0.95,
  sum(rate(http_server_request_duration_seconds_bucket{service="checkout"}[5m])) by (le))

# Rate: request throughput
sum(rate(http_server_requests_total{service="checkout"}[5m]))

# Errors: 5xx ratio
sum(rate(http_server_requests_total{service="checkout",status=~"5.."}[5m]))
/
sum(rate(http_server_requests_total{service="checkout"}[5m]))

# Saturation: DB pool waiters (app-owned)
max(db_connection_pool_waiting{service="checkout"})

# Utilization: heap (platform/agent)
max(container_memory_working_set_bytes{pod=~"checkout-.*"}
/ container_spec_memory_limit_bytes{pod=~"checkout-.*"})Allowed labels on golden signals: service, route (bounded enum), status_class, region. Forbidden by default: user IDs, raw URLs, unbounded exception.message. Those belong in logs/traces, not metric series.
Who does what
The framework only sticks when roles are explicit. Marketing the acronym without ownership is how you get another unused dashboard.
Own the contract and the platform signals
- Publish the DURESS metric catalog and label policy.
- Ship agents/collectors for Utilization and host Saturation.
- Provide a reusable dashboard template and recording rules.
- Gate new custom metrics in CI or collector review.
- Run the collector pipeline, cold routing, and cost controls.
Own SLIs, SLOs, and triage doctrine
- Map each critical user journey to DURESS SLIs.
- Define burn-rate alerts; kill legacy resource-only pages.
- Standardize incident reading order (below).
- Own error budgets and quarterly threshold review.
- Drive game days that break one dimension at a time.
Own app Duration, Rate, Errors, app Saturation
- Instrument handlers with OTel histograms and counters.
- Emit pool/queue saturation for anything you size in code.
- Keep readiness/liveness honest (System health).
- Do not invent host CPU metrics; use the platform ones.
- PR checklist: metric maps to a DURESS dimension or it does not merge.
Own change events and synthetic coverage
- Emit deploy/rollback events onto the System health timeline.
- Wire synthetics for critical paths in every environment that matters.
- Make progressive delivery gates read Duration + Errors burn rate.
- Keep runbooks linked from the DURESS alert payload.
- Prune alert routes so only DURESS pages hit the pager.
Triage protocol (same order every page)
When the pager fires, do not open five random dashboards. Read DURESS in a fixed order so two on-calls reach the same hypothesis.
Duration
Is latency elevated on the customer path? Which route or dependency span? If Duration is fine, this may not be a user-facing incident.
Rate
Is throughput up, down, or shifted? Drop + healthy Duration often means traffic failed before it reached you (edge, DNS, client).
Errors
Is failure rate up? Slice by status class and dependency. Pair with error logs using trace_id.
Utilization + Saturation
Is the service resource-constrained or waiting on a pool/queue? Saturation rising before Duration is your early warning working.
System health
Did a deploy, flag flip, cert rotation, or dependency flap land in the window? Overlay events before you rewrite config under stress.
Duration up, Errors rising, Rate flat, DB pool waiters climbing, CPU moderate, deploy 12 minutes earlier. Classic: pool saturation from a slow query path introduced in the release. Fix is roll back or pool/query change, not “scale CPU.” Without Saturation on the board, teams scaled pods and made the outage wider.
The dashboard
One service template, six panels in reading order, plus a change-event overlay. No per-team snowflake boards as the primary incident view.
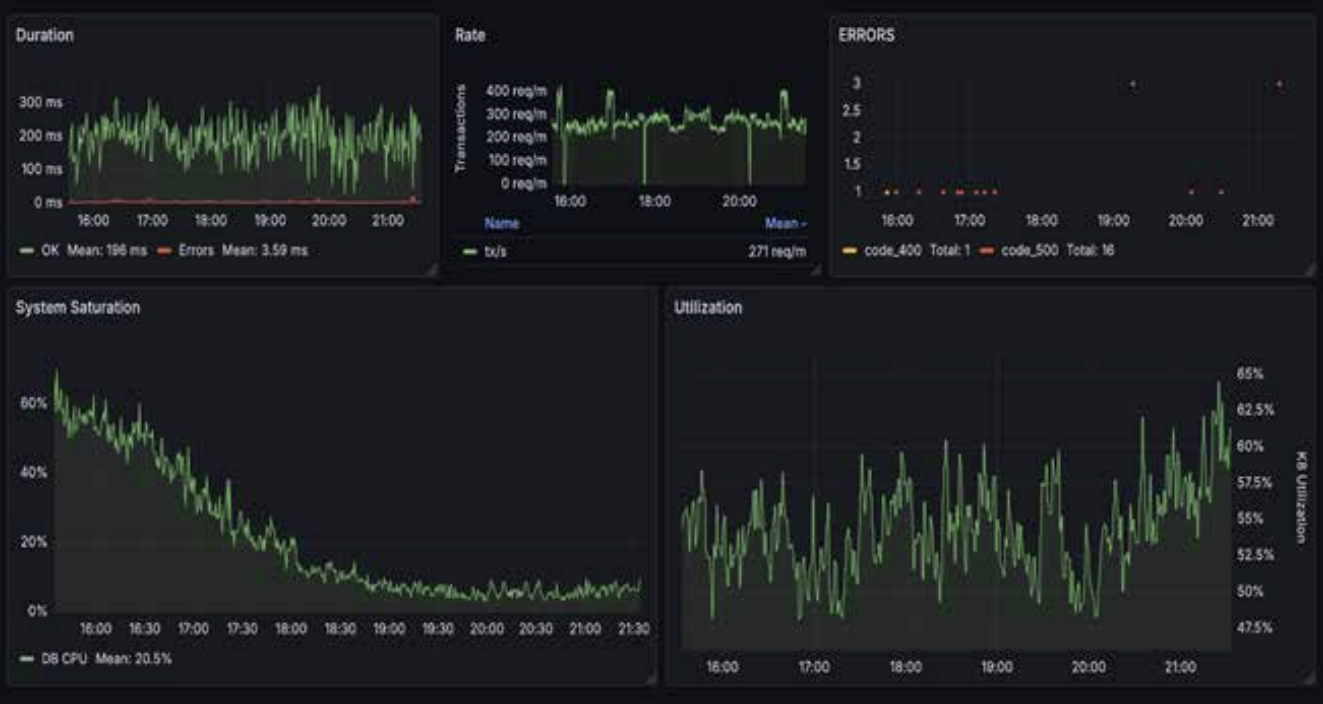 Same six panels for every critical service. Incident response starts here, then drills into traces and logs.
12-week rollout (technical milestones)
Inventory and baseline
Pick the top critical services. For each, inventory existing metrics against the six dimensions. Capture baselines with no new pages yet.
- Gap list: missing Saturation and System health on almost every service.
- Delete or cold-route metrics that map to no dimension and no dashboard.
Instrument to the contract
Close gaps: OTel histograms for Duration, counters for Rate/Errors, pool/queue gauges for Saturation, deploy annotations for System health.
- Platform ships the dashboard template and recording rules.
- Devs land instrumentation PRs; SRE reviews SLI definitions.
Alert rewrite
Replace cliff alerts with burn-rate + leading Saturation warnings. Route DURESS pages to one on-call channel.
- Decommission legacy resource pages that never mapped to user impact.
- Require a runbook URL on every remaining alert.
Make the board default
Incident bridge starts on the DURESS board. Team-specific deep dives stay secondary.
Game days and threshold soak
Inject latency, kill a dependency, fill a queue, fail a synthetic. Confirm the reading order and fix blind spots. Lock quarterly review of thresholds and error budgets.
What changed vs what failed
- Shared language cut cross-team “is it you or me?” loops during incidents.
- Saturation as a first-class panel caught pool and queue failures before CPU looked interesting.
- Burn-rate alerts on Error + Duration SLOs replaced noisy raw counters.
- Cardinality policy stopped metric cost from growing faster than the fleet.
- Role clarity: Platform owns the contract, apps own compliance, SRE owns paging doctrine.
- Skipping baselines produced fake thresholds and a second wave of alert fatigue.
- Running legacy pages beside DURESS split attention until we deleted them.
- Treating Utilization as “the health dashboard” kept teams scaling the wrong resource.
- One-off snowflake dashboards undid the shared triage order within a sprint.
- Calling it a project instead of a contract: without CI/collector gates, custom metrics crept back.
Start this week
Checkout, login, or payment. Write the six DURESS rows for that path only. Mark each cell: present, wrong, or missing.
Add missing Duration histograms, Error ratios, Saturation gauges, and deploy events. Do not add alerts yet.
Define latency and availability SLIs. Page on burn rate, warn on Saturation. Delete one legacy cliff alert the same day.
Clone the dashboard template for the next services. Add a PR check or collector rule: no unmapped custom metrics.
Every game day and every incident review: did we walk Duration → Rate → Errors → Utilization/Saturation → System health?
Practice the reading order
Walk a live P1 with the same six panels
This case study is the contract. The interactive tutorial is the drill: order-service latency at 2,847ms, DB pool at 94/100, then traces and logs until the root cause is obvious. Same DURESS order as above.
Open the SRE Dashboard tutorial · related deep dive: Are your systems actually healthy?
Bottom line
DURESS is a contract, not a slogan
Platform Eng publishes the dimensions and label rules. Devs instrument Duration, Rate, Errors, and app Saturation. DevOps feeds System health with deploys and synthetics. SRE turns the signals into SLOs and a fixed triage order. Do that, and green-but-broken dashboards stop being a personality problem and become a missing-row-in-the-contract problem you can fix in a PR.